


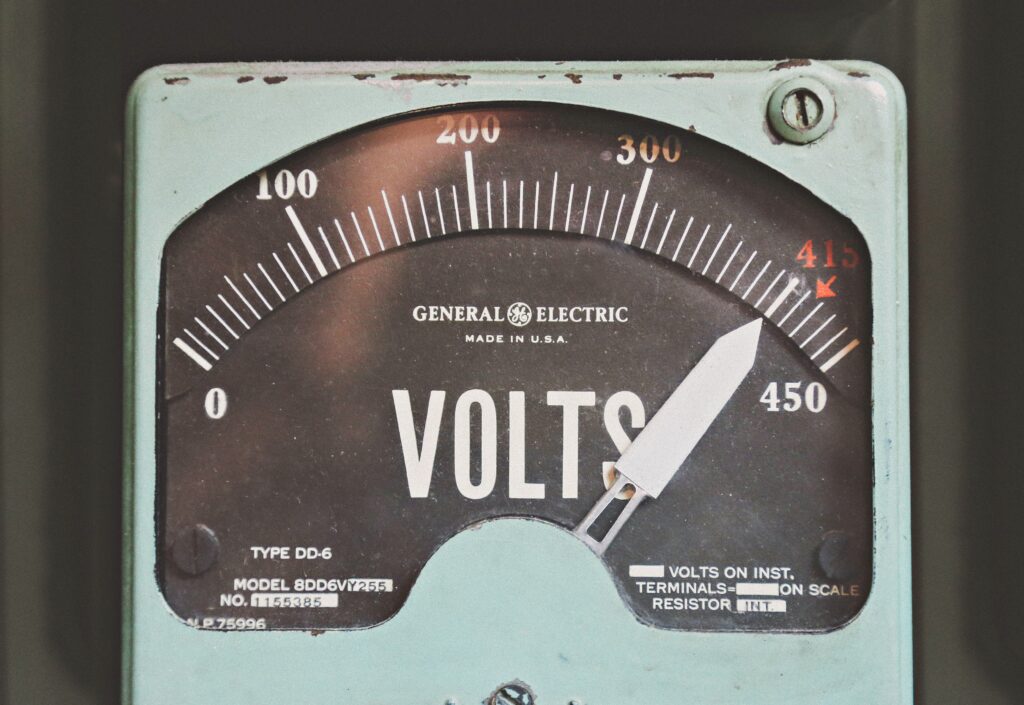
Key takeaways
- Your meter records power draw as a running average every 15 minutes, all month long.
- The utility picks the single highest interval and multiplies it by the demand rate.
- That one 15-minute window determines your entire monthly demand charge.
Most facility managers know their electric bill includes a demand charge. Very few know how that charge is actually calculated. It is not based on how often you draw a lot of power. It is not based on how long you draw a lot of power. It is based on one 15-minute interval, once per month, chosen by an algorithm no one at your facility ever sees.
Understanding how that interval works, and how to find the one that hurt you last month, is the first step to actually reducing demand charges.
What Is a 15-Minute Interval?
Every commercial and industrial electric meter in North America records data on rolling 15-minute intervals. Every fifteen minutes, the meter averages the kilowatt draw across those fifteen minutes and stores that number. Over a 30-day month, that produces about 2,880 individual readings.
Your utility looks at all 2,880 readings. It picks the single largest one. Then it multiplies that number by your demand rate to calculate your monthly demand charge. Everything else in those 2,880 intervals is ignored for demand billing purposes.
Rolling vs. Fixed Intervals
Not all utilities read intervals the same way. Most use rolling intervals, meaning the meter is always measuring the last fifteen minutes at any given moment. A few utilities use fixed intervals aligned to clock time (00-15, 15-30, and so on).
The difference matters. On a rolling interval meter, a two-minute spike in power draw can influence readings for the next fifteen minutes. On a fixed-interval meter, a spike that happens to straddle two intervals gets averaged into both, potentially setting a lower peak on each. Knowing which method your utility uses changes how you sequence your operations.
The peak isn’t visible on your bill. It’s buried in interval data.
How to Find Your Peak Interval
Your monthly bill shows the peak demand number in kilowatts and the resulting charge in dollars. It does not show which day the peak occurred. It does not show the time. It does not show what equipment was running.
To find that information you have to request interval data from your utility, typically as a Green Button download, a CSV export from your utility portal, or a data feed to a third-party analytics platform. Some utilities charge for this. Most take a few weeks to process the request.
Once you have the data, finding the peak is a five-minute task. Sort by kilowatts descending. The top row is the interval that set your monthly demand charge. Now check the timestamp and correlate to your production log. That is where the diagnosis starts.
What Actually Happens During a Peak Interval
The vast majority of peak intervals are caused by three patterns.
Coincident equipment startups. Two or more large loads ramp up in the same fifteen minutes. The combined draw exceeds the individual draw of either piece of equipment. The trap: shift changes, first-of-day startups, batch transitions.
Ambient-driven load stacking. Weather or seasonal conditions cause equipment to work harder than usual, and multiple systems respond at once. The trap: hot day + shipment loading + compressor ramp-up.
Isolated inrush events. A single motor starting up creates a short current spike, but if the interval catches it, that spike inflates the entire fifteen-minute average. The trap: large motor startups without soft starters.
The Cost of a Single Bad Interval
Consider a facility with a typical operating peak of 600 kW. On the fifteenth of the month, a batch transition coincides with a compressor cycle and the interval registers 900 kW. Everything else that month averages 500 to 620 kW.
At a demand rate of $18 per kW, that facility’s monthly demand charge is $16,200 (900 kW × $18). If the peak had stayed at the typical 600 kW, the charge would have been $10,800. The difference: $5,400 for that one interval.
$5,400 for fifteen minutes.
Real cost of one uncontrolled peak
Over twelve months, avoiding that one bad interval each month adds up to more than $60,000. And in most cases the operational change required is trivial: a five-minute delay in one startup sequence.
How DataWrangler Analyzes Interval Data
DataWrangler installs precision meters at the utility feed and pulls interval data every day. When a demand peak occurs, our analysts identify the exact fifteen-minute window, correlate it to equipment logs and operational schedules, and deliver a monthly report explaining what happened and how to prevent it. That is the mechanism behind 10 to 25% reductions in commercial electric bills.
Waiting to look at interval data until the bill arrives is too late. The peak has already been set. The charge has already been calculated. Real demand management requires seeing the data as it happens, so that operational changes can be made before the next peak lands in the same fifteen-minute window.
See Your Own Interval Data
If you have never looked at your facility’s interval data, the exercise is worth the effort. Contact your utility, request thirty days of interval readings, and find the peak. That single number is what set your demand charge. Now ask what was running at that time.
If you want DataWrangler to run that diagnosis for you, upload your bill or see the full commercial platform.